Quinn's new dashboard
Commonalities
What do the UG amendment 2021, which imposed far-reaching changes in ECTS minimum credits and consequently ECTS fairness, and our web developer Hanna have in common? They both started in October 2021. And the similarities don't end there. While the UG amendment brought a noticeable push for our ECTS evaluation app Quinn from universities and colleges, we threw the new Dotbite developer in at the deep end and let her single-handedly independently develop the Quinn dashboard project.
Lots of Potential
We knew from the beginning that our app Quinn had tremendous potential, but ongoing projects like timebite or LEAD Horizon didn't allow us the time to make the changes we wanted. One internal improvement request that had been on our ToDo list for a long time was a clear representation of all incoming data in a single, modular dashboard. Hanna joining us allowed us to tackle this project while allowing her to take self-determined and independent ownership right from the start.
"It was really cool to get responsibility from the beginning and to be able to tinker with the dashboard. The graphs were technically new for me, but I really enjoyed having a little challenge."
Hanna
Evaluating Needs
As with any Dotbite project, the Quinn Dashboard was designed with an excellent user interface, so we created a design mockup even before all the features were decided. The focus was on meaningful graphs, clearly visible correlations, and easy ways to combine the collected data.
With the mockup and our own ideas for visualizing the data, we went to our partner university TU Wien and discussed what they themselves needed and what modular features might be interesting for other universities. With this insightful information, Hanna designed a wireframe for the dashboard and set to work developing her first own Dotbite project.
Development
While we mainly relied on Flutter for the Quinn app, the dashboard was implemented using Laravel, Vue.js, and Bootstrap. For the visualization of the graphs, which play a central role in the new dashboard, we used the JavaScript library ApexCharts.
We also discussed a lot during development which statistics made the most sense and which data should be included in which statistics and graphs. For example, one question we had was whether an average effort should consist of all tracked hours or only the tracked hours of users who had completed their courses. In this way, we had to constantly evaluate what the user actually expects and wants to see on the dashboard for the respective statistics.
Technically, it was a challenge to see if the database queries and the representations were correct at all. Whether there are inconsistencies is often best seen with large amounts of data, so we conducted rigorous tests with actual and fictitious data sets.
"Rarely have I had to get so absorbed in database queries on a project; it took a lot of time but was also really fun. In my notebook, you can find some doodles, which are actually reflections on the queries."
Hanna
Quinn Dashboard Features
Statistics
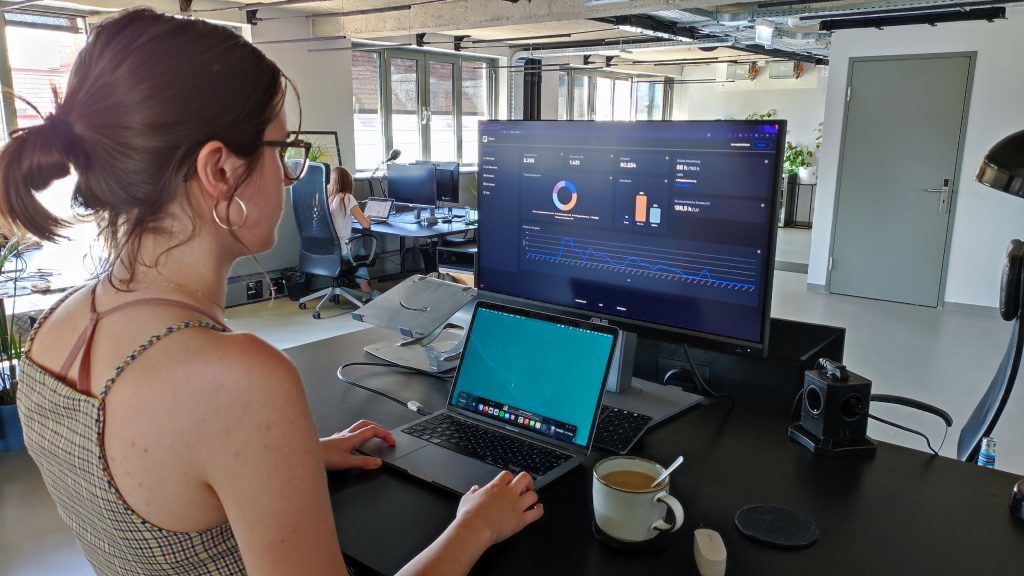
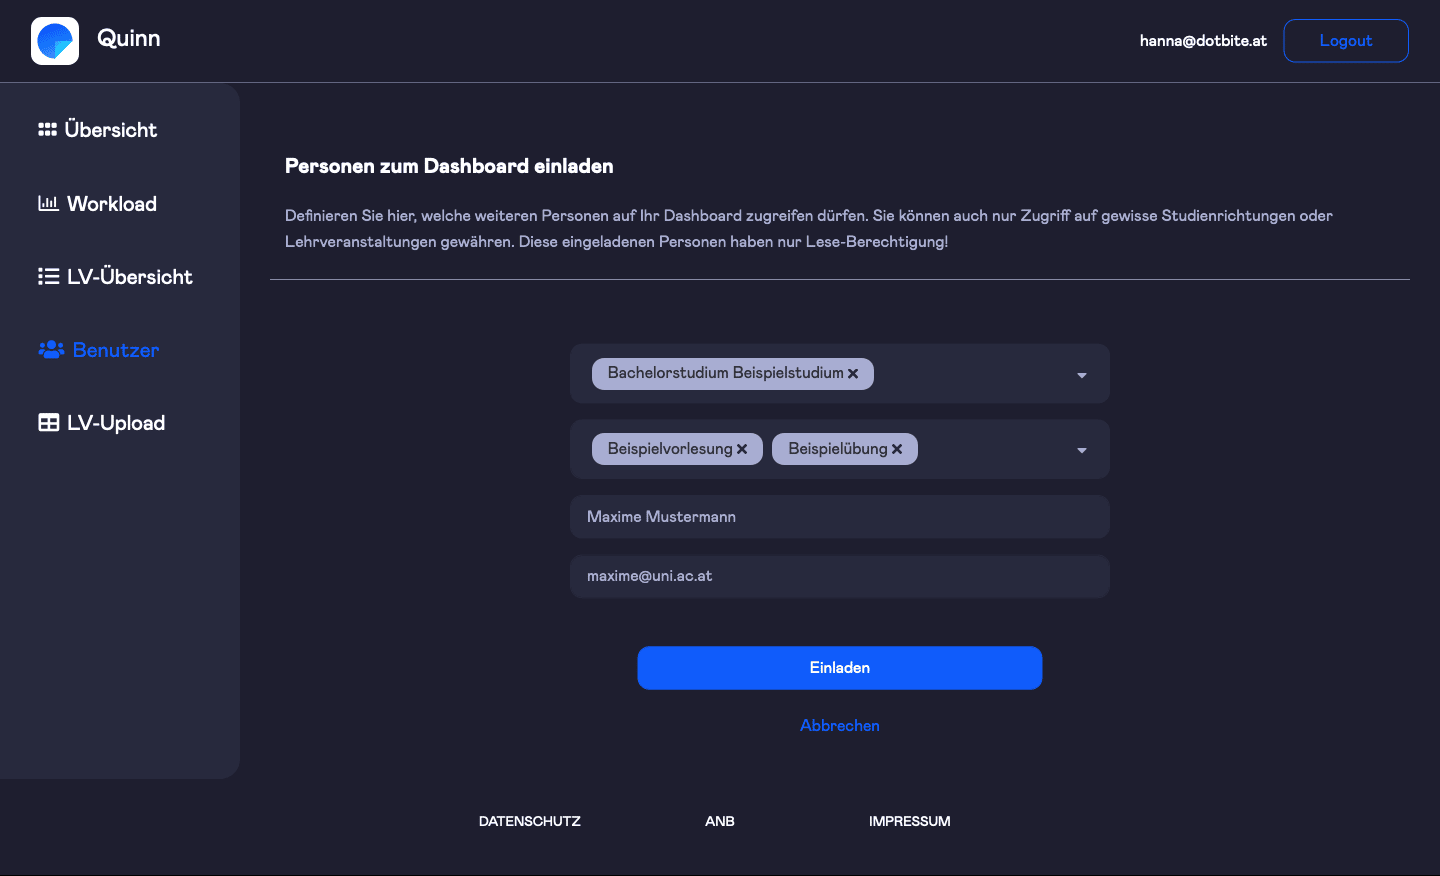
The Quinn Dashboard tracks both university-wide statistics about users who use the app (such as average hours tracked per course, gender, number of entries over time, or the course with the most significant deviation from ECTS), as well as course-specific statistics (such as total documented effort per user). Both types of statistics are illustrated by a variety of meaningful graphs. The data is presented in detail so that it does not have to be tediously analyzed by the university itself.
Live data export
If there is a need to analyze specific data, there is a data export for each course, with which the tracked data of the students can be exported as an Excel file with just one click.
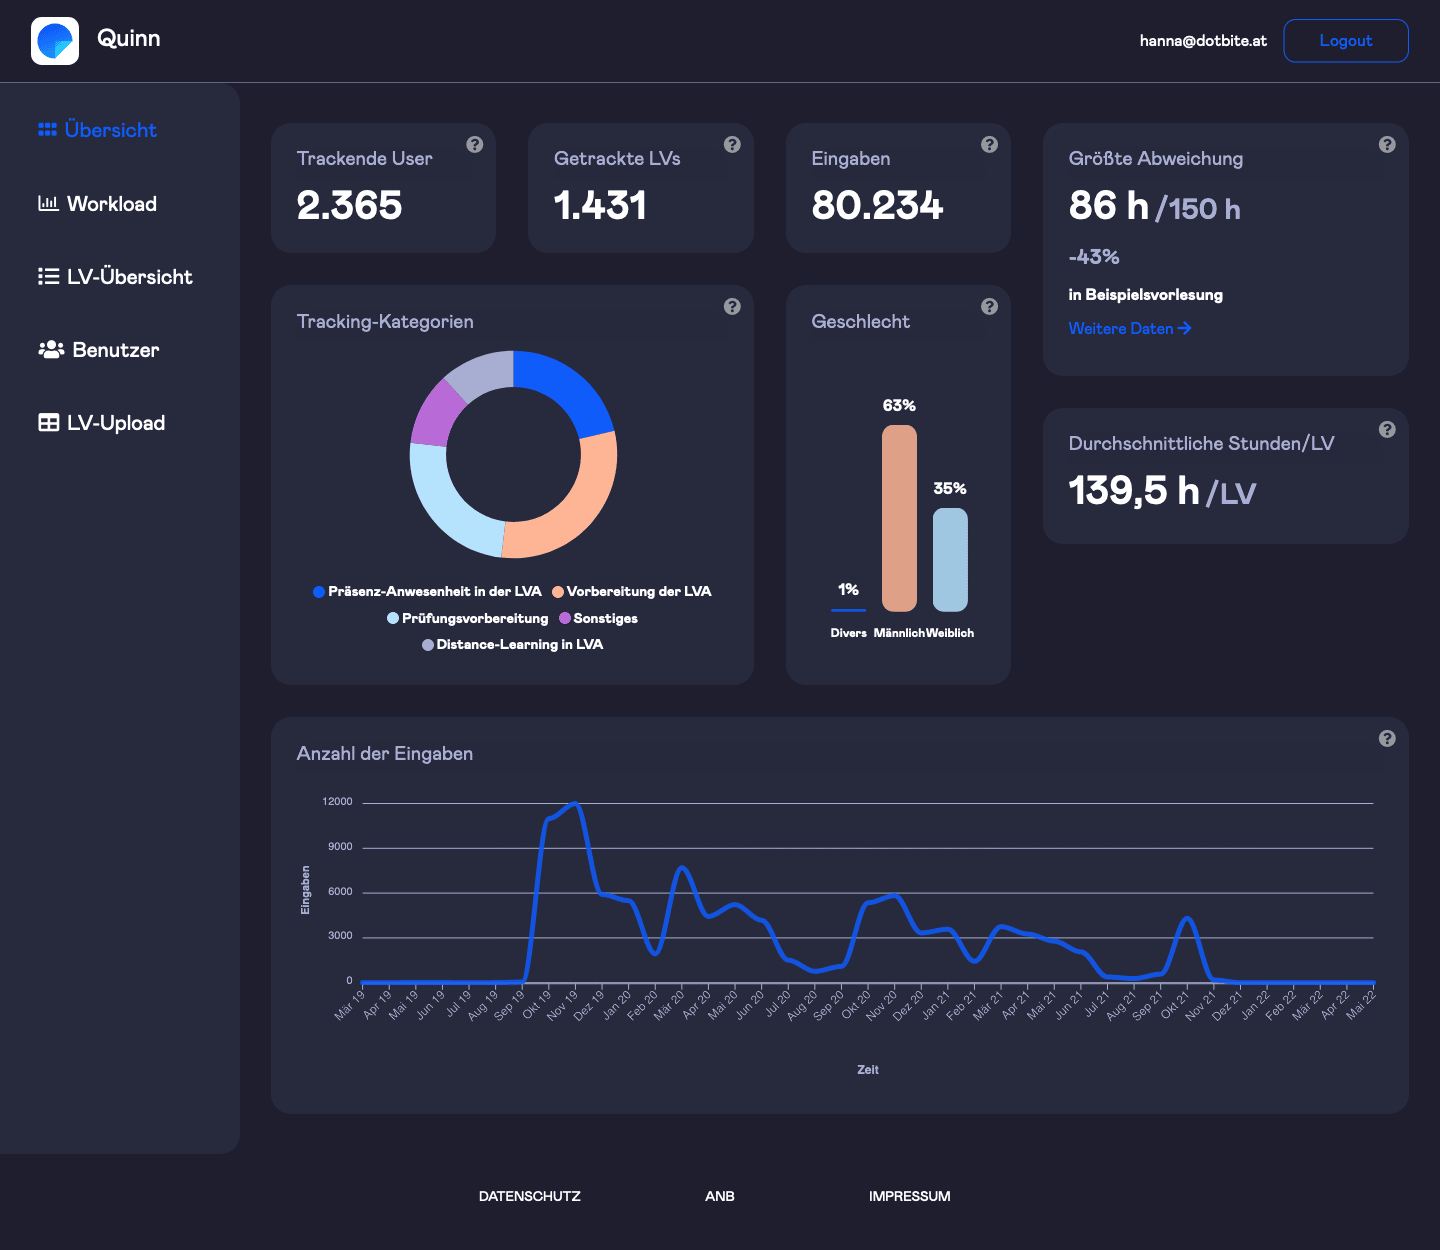
User management
The university admin can create users who can be assigned specific access rights to only see certain courses in the dashboard (e.g., lecturers or program directors/assistants for their own classes). In this way, universities can precisely limit who from their team can work with which data.
Design
Meaningful data needs a clear visual representation to be of value. Therefore, our design team has created a comfortable user interface with a dark mode inspired design that allows insight into all key data points at first glance.
"Our clients have long wanted a concise dashboard where they can see all the relevant current information at a glance and don't have to arduously evaluate individual data points. We took this up and expanded it with features that allow the universities to work independently, so they don't need any help from us."
Hanna
Immediate Success
Our feeling that digital ECTS evaluation has excellent potential and that the development of additional features for Quinn makes sense was soon confirmed. Even before the actual release of the dashboard, we had contacts with two universities that found Quinn very appealing. They were enthusiastic about the prototype of our dashboard, and their feedback flowed directly into the final spurt of development. Thus, in addition to completing the project, we could celebrate two new customers this spring.
"It felt good to get the project online after honing it for a couple of months, and knowing that the dashboard is actually being used now by several clients is especially cool!"
Hanna
Ready to connect the dots?

Hi, I’m Emir, CEO and Co-Founder of Dotbite.
You have an interesting idea for a digital project and are looking for a sparring partner pushing the challenge through with you?
You’ve come to the right place.